Team Performance Report
The Team Performance Report in SparrowDesk helps support leaders monitor and compare performance across teams and agents. This report highlights critical metrics such as response times, resolution efficiency, and individual contributions, enabling data-driven decisions for coaching, staffing, and workflow improvements.
Who Can Access This Report?
Anyone with permission to access the Reports module will be able to view the Team Performance Report.
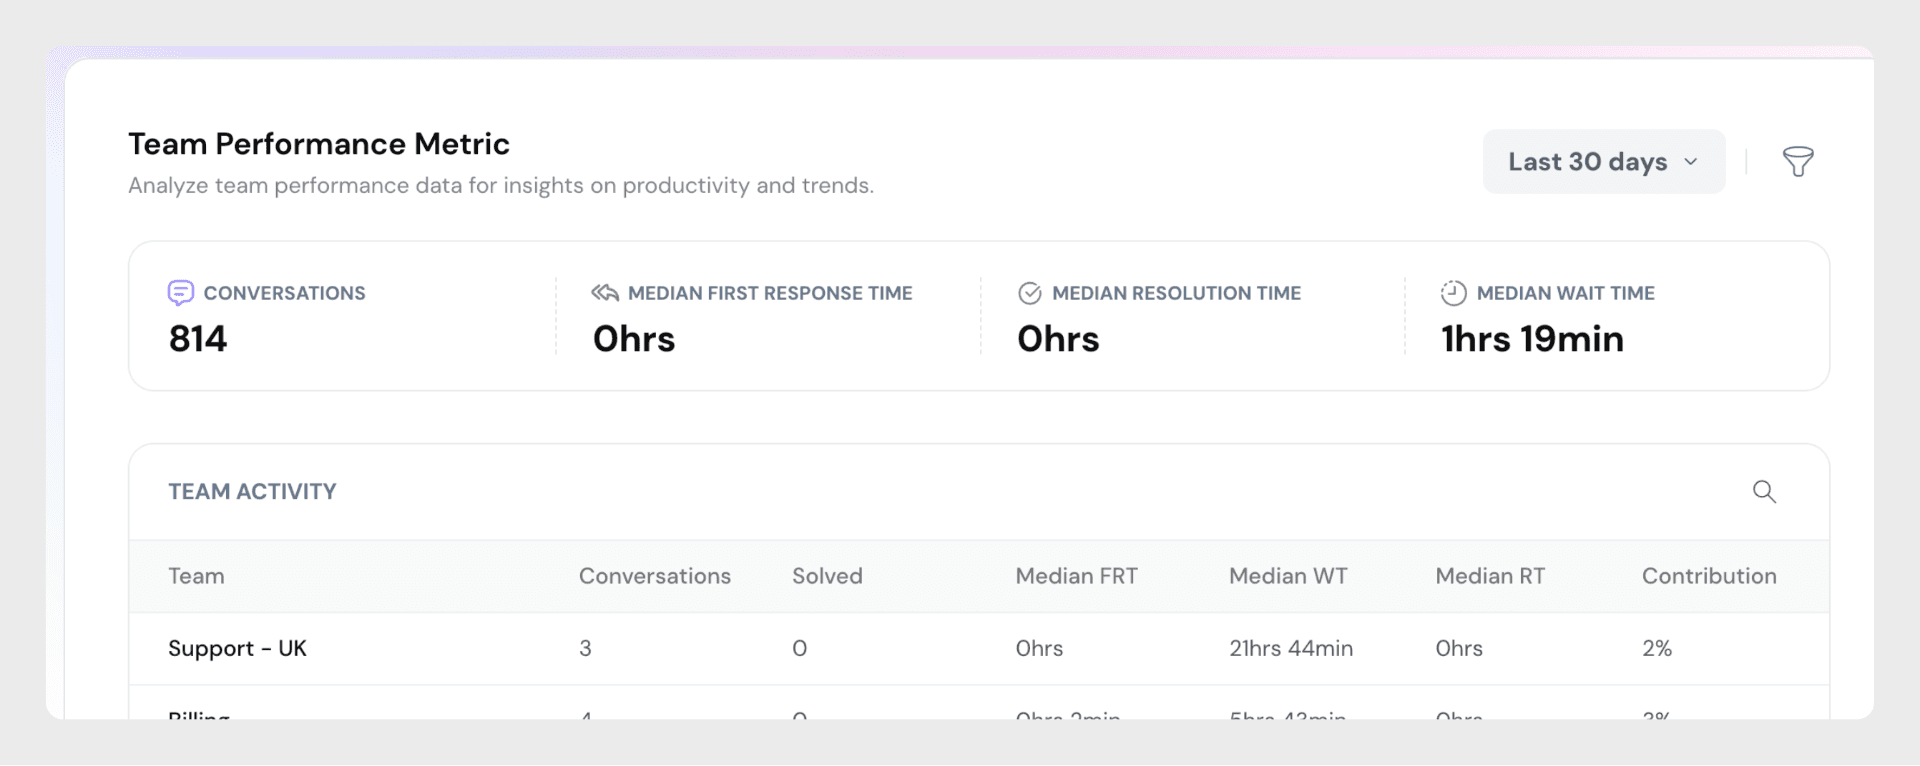
Key Performance Indicators (KPIs)
All KPIs are calculated based on conversations assigned and responded to by agents.
Conversation Count
- Total number of conversations handled by each team.
- Reflects the volume of workload taken up by the team.
Median First Response Time (FRT)
- Median time between ticket creation and the first agent reply.
- Measures how quickly a team acknowledges incoming requests.
Median Resolution Time (RT)
- Median time from conversation creation to resolution.
- Indicates how fast teams are able to resolve issues.
Median Wait Time (WT)
- Average duration a customer waits between their message and the next agent reply.
- Helps assess how responsive the team is across the conversation lifecycle
Team Activity Table
This table gives a comprehensive, team-level breakdown of key performance metrics. It allows you to analyze how each team is performing across various dimensions such as conversation volume, responsiveness, and resolution speed.
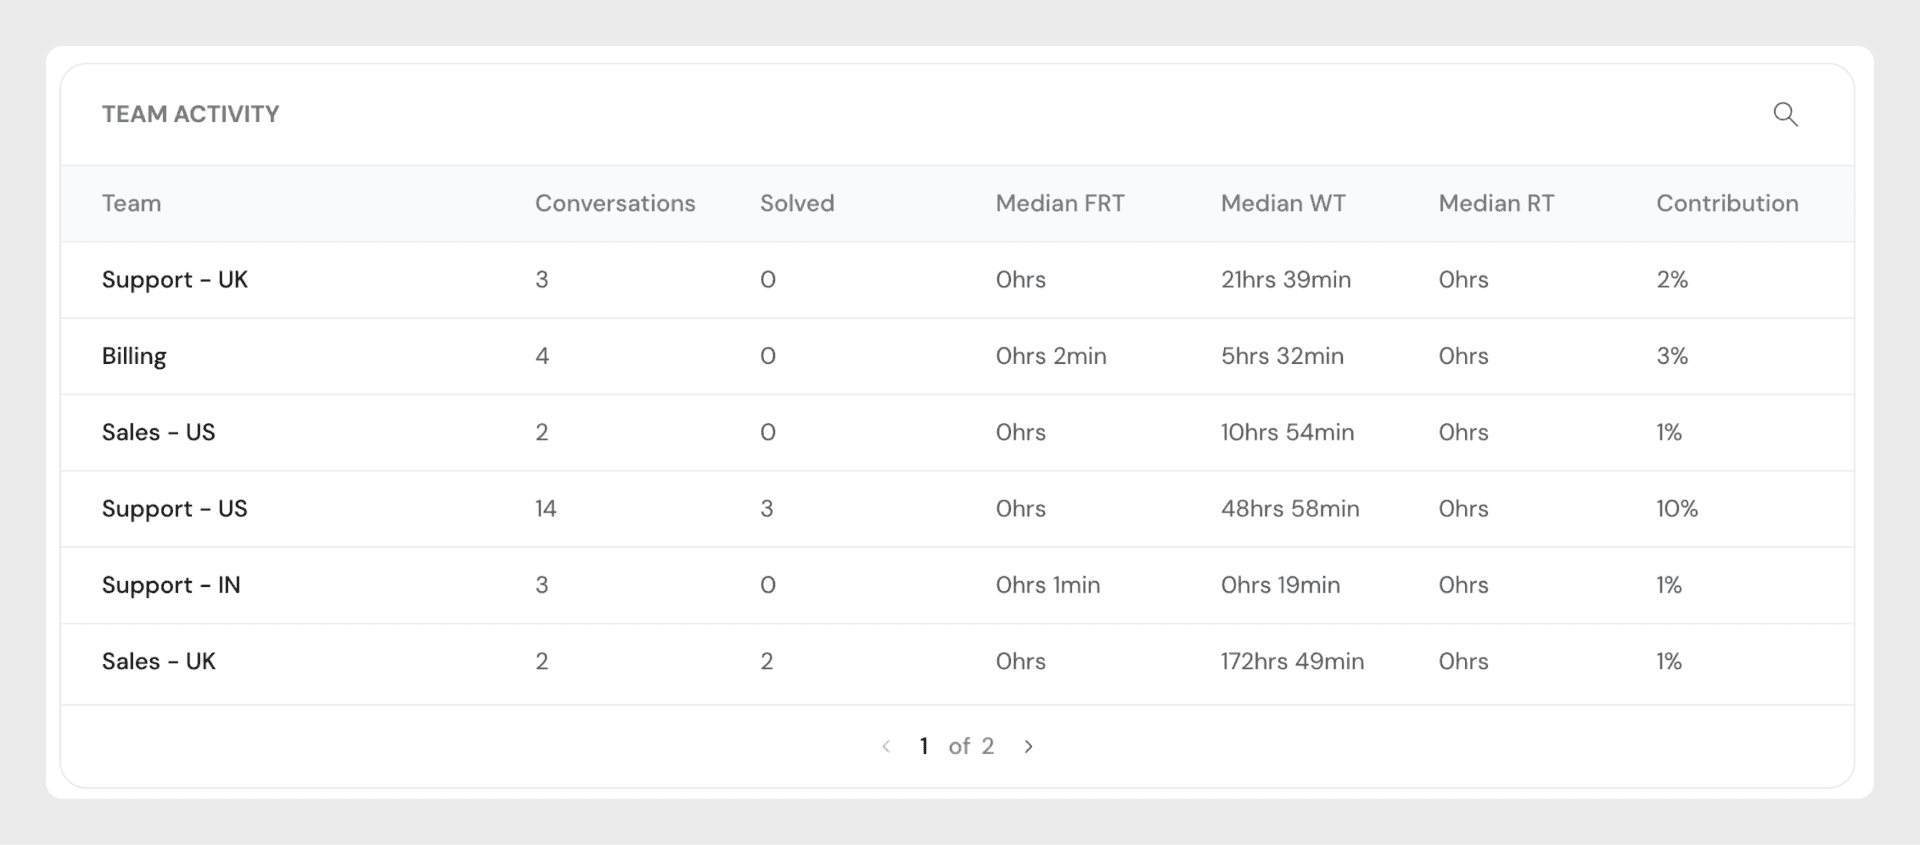
Contribution % is the share of the team’s handled conversations relative to the total handled during the time period.
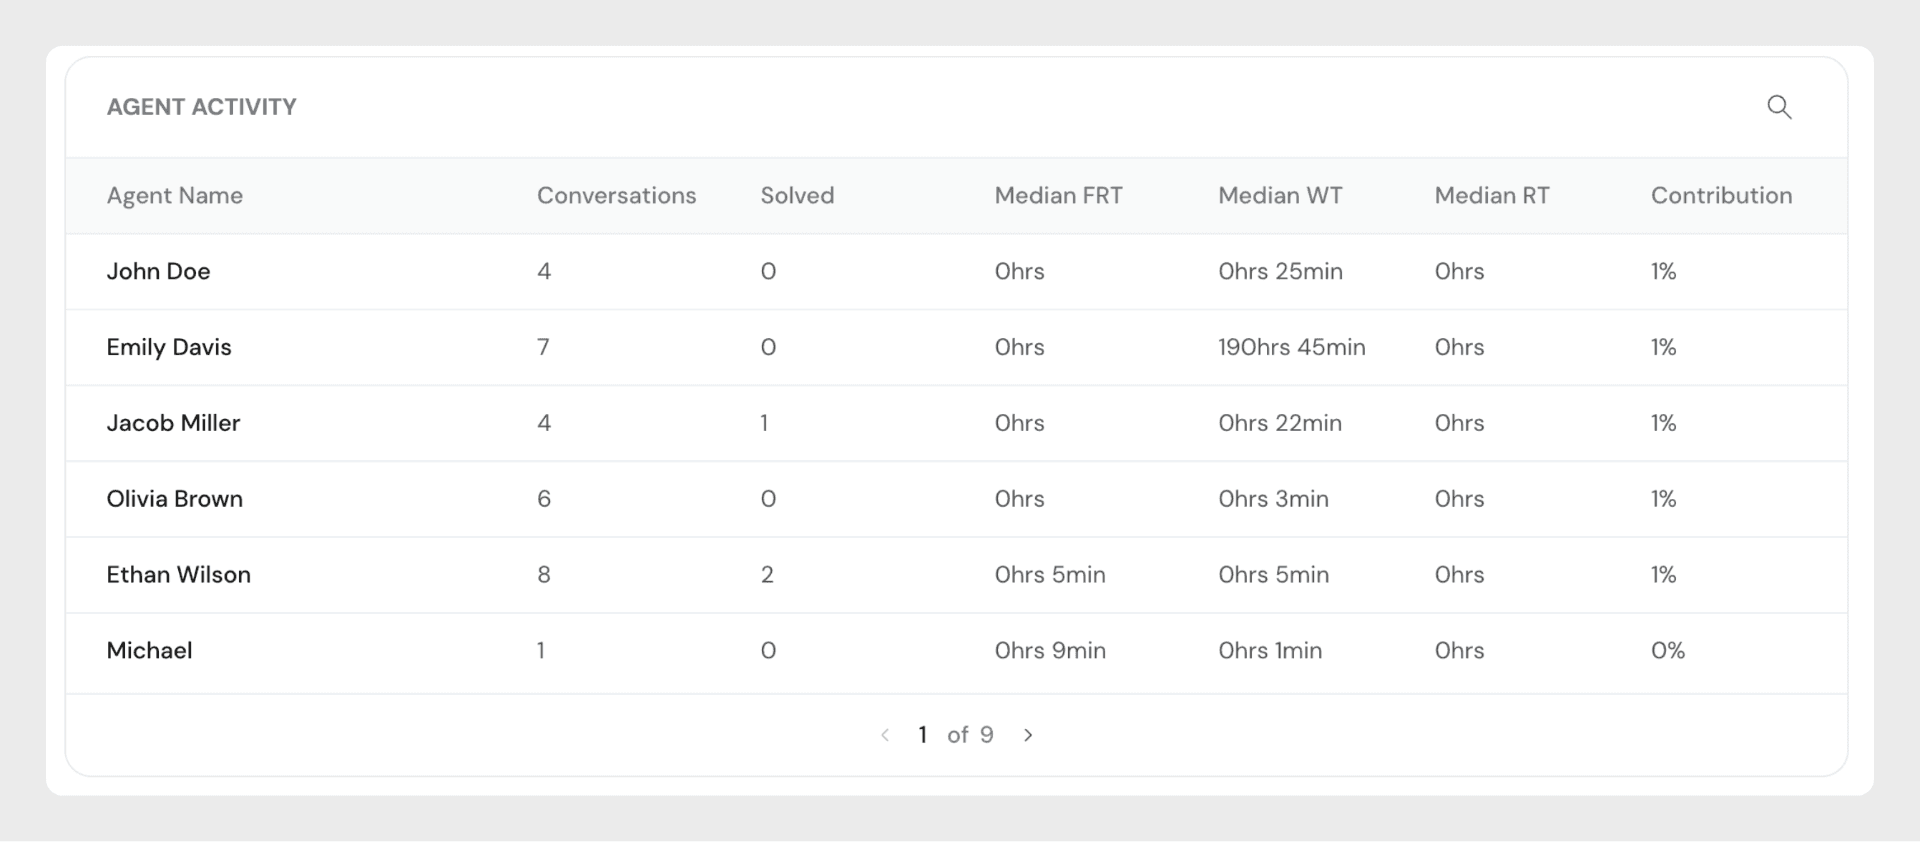
Agent Activity Table
This table offers a detailed, agent-level view of performance metrics. It shows how each individual agent contributes to their team's support operations across volume, responsiveness, and resolution speed. This view is particularly helpful for:
- Recognizing top-performing agents
- Spotting agents who may need support or coaching
- Understanding workload distribution within teams
- Encouraging accountability and transparency across the support function
Each row corresponds to a specific agent, and the associated data helps you pinpoint where strengths and bottlenecks lie on an individual level.